How Canva Handles Billions of Events to Track Content Usage
Understanding The Evolvement of Canva's Content Usage Counting Service Architecture
Requirements
Canva allows designers, artists, photographers, etc., to share their work with millions of Canva users and earn royalties when their designs are used. The content usage counting service tracks the usage data to calculate monthly payouts. The main challenges for the system are:
Accuracy - The usage count should be accurate, and the system should avoid data loss or overcounting.
Scalability - The system should allow the processing of the data that results from large organic growth over time.
Operability - As the volume of the data grows, the operational costs related to maintaining the system will also increase.
Architecture
The content usage counting service processes the data in three stages:
Data Collection - Usage events are collected from all user interfaces, such as web and mobile apps, followed by validation and filtering of invalid events.
Deduplication - Any duplicate events are also dropped
Aggregation - Usage metrics are calculated based on dimensions such as per template, etc.
Initial Design — Incremental Counting
Initially, all three stages were built as separate components, with the output of one stage saved in a database (MySQL) and read by the next stage. This system performed incremental counting. For example, the aggregation workers scanned the deduplicated data table and updated the usage data counters in usage tables. This design had three significant issues:
Scalability
Data scans were single-threaded, using a pointer to remember the last read record. Reading each event required an entire database round trip (one for reading and one for writing). This resulted in a complete scan taking O(N) queries, where N is the number of usage records.
Batching reads, in this case, doesn’t improve scalability as O(N/C), where C is the batch size, is still O(N)
Multi-threaded scans would increase code and operational complexity.
Incident Handling:
Counting services often face scenarios related to overcounting, undercounting, misclassification, and processing delays, which require engineers to look at the databases and fix broken data.
Overcounting — where one or more events are counted more than once
Undercounting — where one or more events are missed or dropped from counting
Misclassification—Based on the pricing structure listed, each event must be categorized correctly to find the right payout amount. An event with an incorrect category can result in an over- or under-payout amount.
Processing Delay—Scenarios in which a particular pipeline stage is stuck or experiencing degraded performance can result in an overall processing delay, impacting the payout timeline.
Storage Utilization:
Organic growth and storing intermediate-stage output data resulted in quick storage capacity consumption. This also impacted the time required to perform database maintenance, thus increasing the operational load.
New Design — Upgrade to OLAP Database
The raw event usage data in the collection stage was moved to DynamoDB to address the storage scalability concerns. However, the databases in other stages were not moved to DynamoDB as it would not solve the database round-trip issue faced during counting.
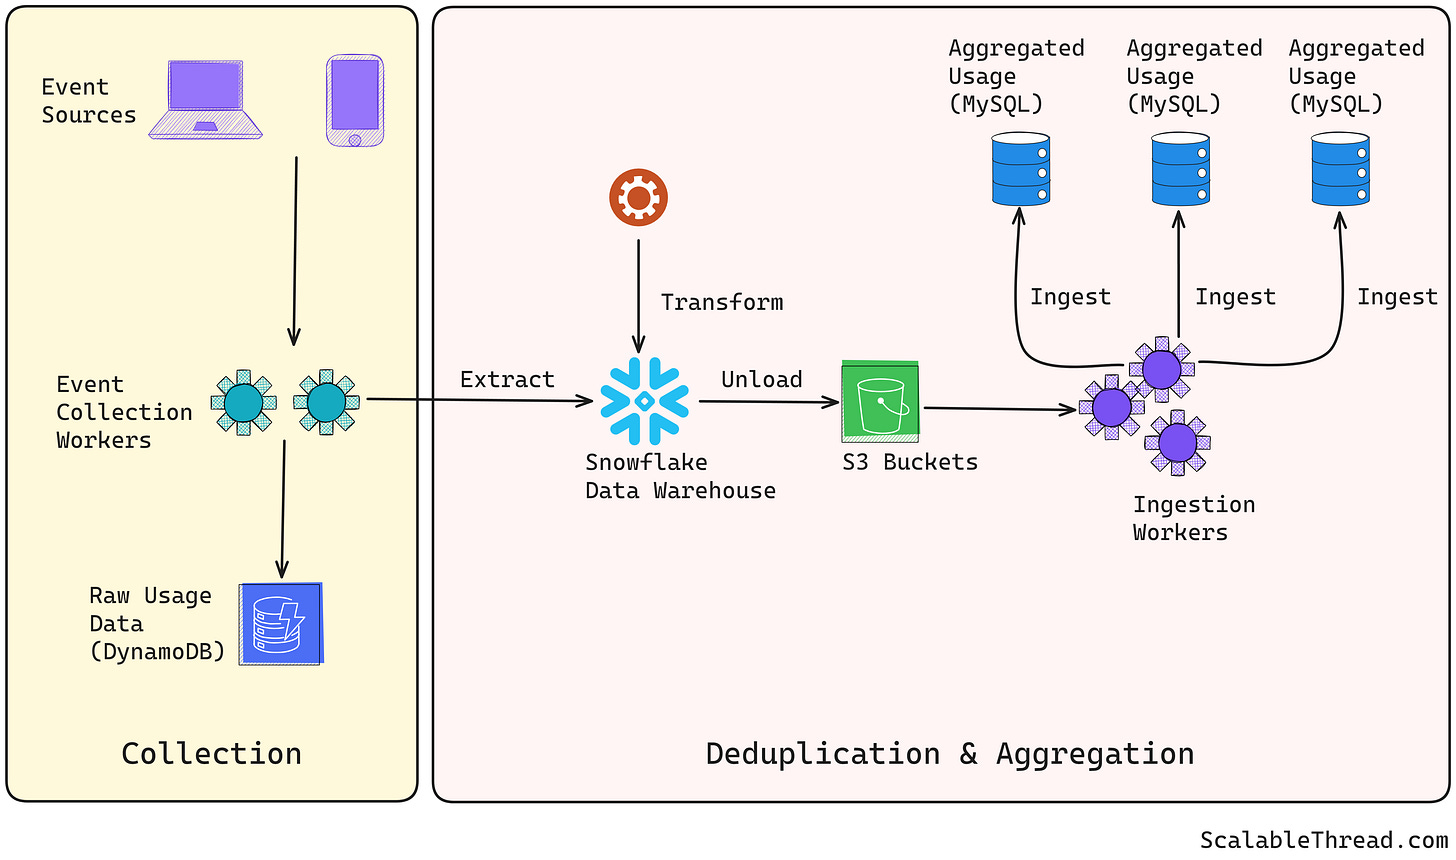
To address this, the deduplication and aggregation stages were combined, eliminating the intermediate output storage. To speed up the processing, the deduplication and aggregation stages were moved to an OLAP (Online Analytics Processing) Database. This allowed for complex data analysis and quick reporting of the usage data. Canva’s team decided to use Snowflake as their OLAP database.
Extract and Load: Usage data was extracted from DynamoDB and loaded into the data warehouse using the internal data replication pipelines.
Transform: The transformation for each stage (deduplication and aggregation) was written as an SQL query that read data from the previous stage and outputted it to the next stage. This allowed the intermediate-stage data to be kept as SQL views, which are simple and allow more flexibility.
Improvements with New Design
Reduced Operation Complexity: Since deduplication and aggregation stages moved to SQL queries from physical services, the operation overhead to maintain the system was significantly reduced. Also, undercharging, overcounting, misclassification, etc., could be overcome by restarting the pipeline from end to end without engineers spending time on fixing broken data.
Reduced Data and Code Complexity: Moving deduplication and aggregation stages to the OLAP database also reduced the overall data stored by 50% and the code by thousands of lines.
References
Scaling to count Billions - Canva Engineering blog. (2024, April 12). canva.dev. https://www.canva.dev/blog/engineering/scaling-to-count-billions/


